Rust Profiling in WSL2 with CLion

Code from this example is here: https://github.com/wkennedy/wsl2-rust-profiling
Having recently switched some of my coding to remote development in WSL2 with CLion, I noticed that profiling was not readily available. I tried various proposed solutions, but didn't have much success until I came across this gist: https://gist.github.com/abel0b/b1881e41b9e1c4b16d84e5e083c38a13
At the bottom of that thread is a suggestion to run these commands:
In the Windows shell run:
wsl --update
Then in WSL2 (assuming it's Ubuntu) run:
sudo apt update
sudo apt install flex bison
sudo apt install libdwarf-dev libelf-dev libnuma-dev libunwind-dev \
libnewt-dev libdwarf++0 libelf++0 libdw-dev libbfb0-dev \
systemtap-sdt-dev libssl-dev libperl-dev python-dev-is-python3 \
binutils-dev libiberty-dev libzstd-dev libcap-dev libbabeltrace-dev
git clone https://github.com/microsoft/WSL2-Linux-Kernel --depth 1
cd WSL2-Linux-Kernel/tools/perf
make -j8 # parallel build
sudo cp perf /usr/local/bin
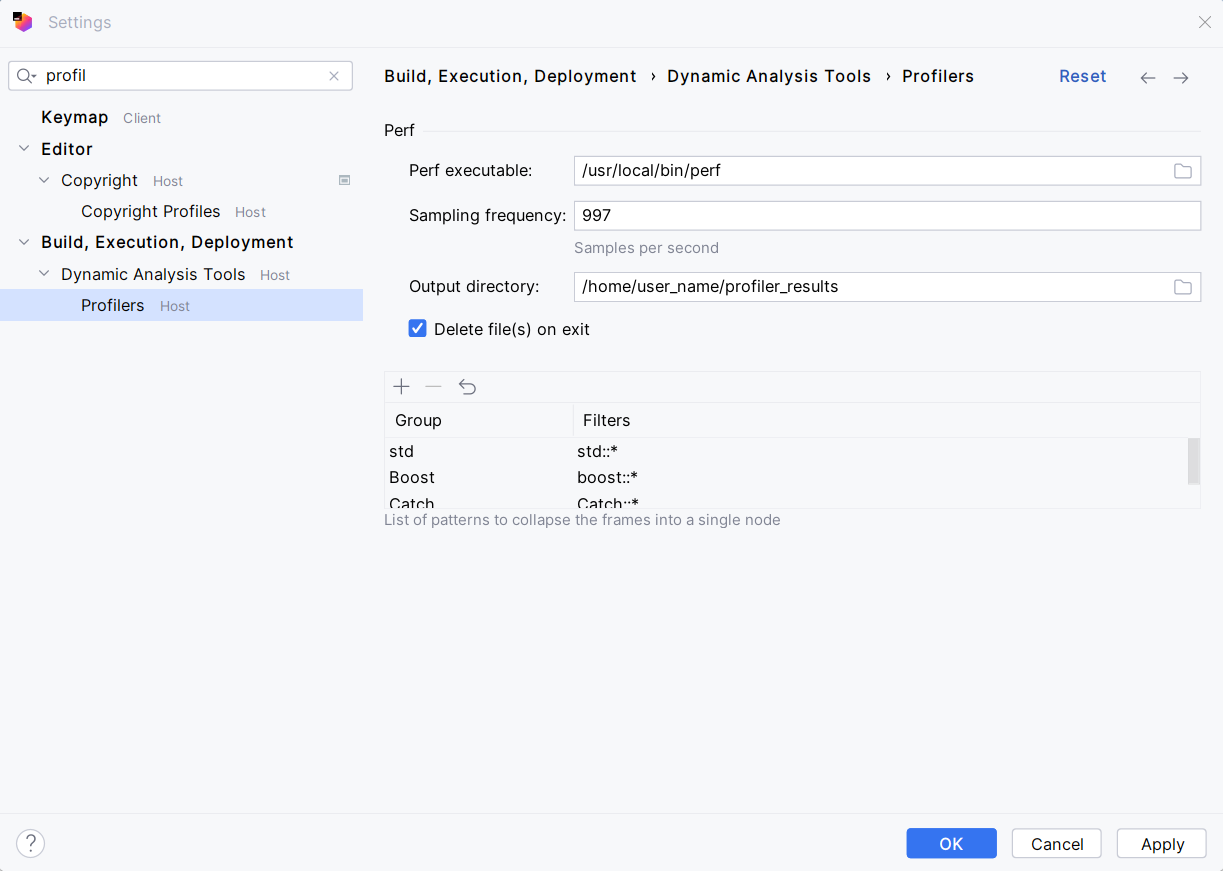
After those updates are done, go to the CLion settings you and search for "profiler" and check that perf is configured correctly:

When you try to run your application with profiling, you may see an error stating the profiler can't start:


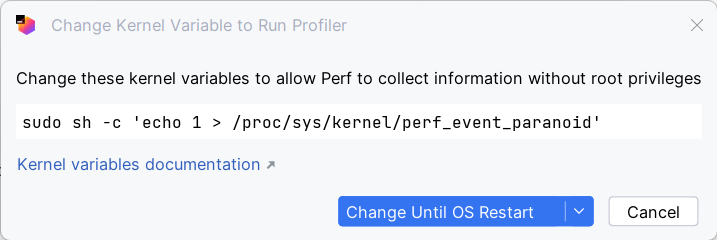
If you click on the notifications tab in the upper right corner, you'll see more details on the error along with the ability to configure a fix. When you click "configure" you'll see the following suggestion. Depending on your setup you may see more commands to run and you may have to manually run the suggested commands manually in your WSL2 terminal.

Once the kernel variables are set we can attempt to profile our application again.

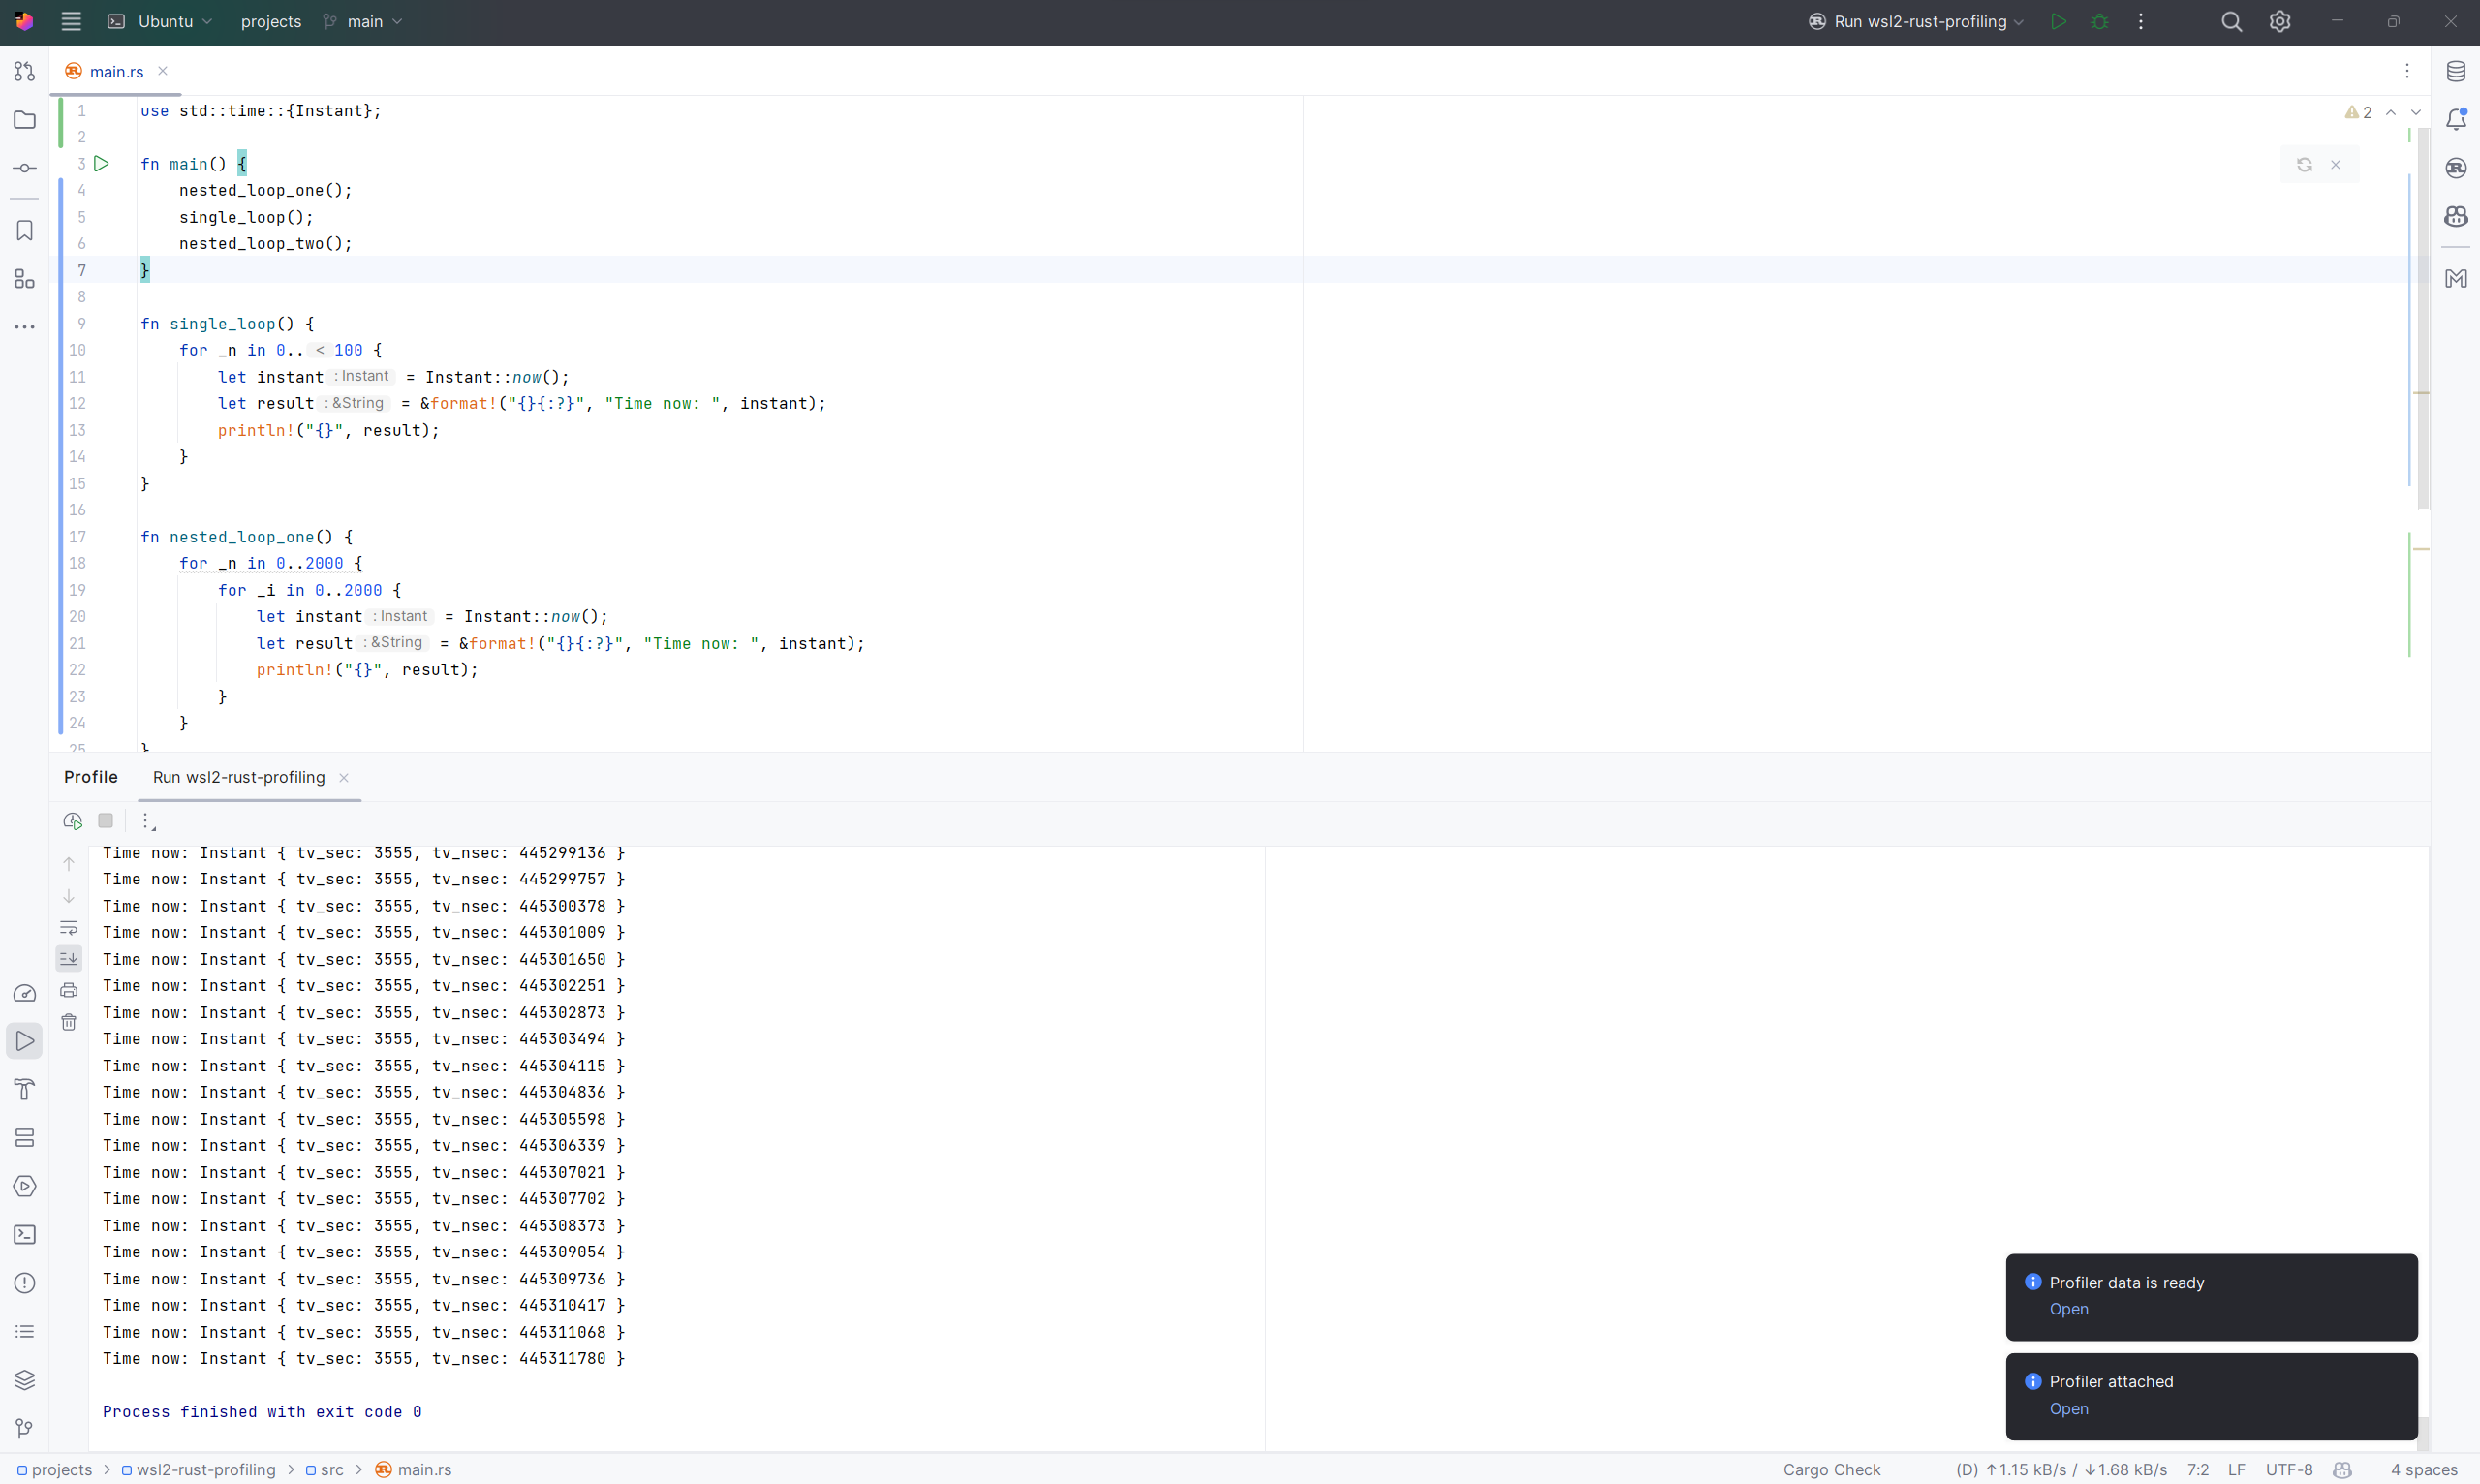
If the program run successfully you should see a message in the right lower corner stating that the profiler is attached and finally that the profiling results are ready to view. You can also open the results from the notification tab.

Click "open" and you'll see the results graph.

There is a lot to digest here, and digging through this data is for another post. But for now we can try to identify the hot spots in the code. Looking at this graph we can see our main function, then right above it two of our other functions, "nested_loop_one" and "nested_loop_two". Let's look at the call tree of t he execution just for the wsl2-rust-profiling application. Expand the call tree:

We can clearly see the functions in our code that are taking the longest time to run. Of course, this is a simple example with functions that we new ahead of time were less than ideal. But we now have profiling working with CLion and WSL2 which are powerful tools to better optimize our code.